In this post, I will share my GitHub repository which you may refer to develop your own model. It comprises implementation for training, testing and interpretation. This post will cover the following sections:
- Setup
- Training
- Testing
- Interpretation (covered in the testing section)
- Output
Repository Link: The source code is available here.
Setup
Begin by installing the required packages listed in requirements.txt
Training
- train_caller.py = Loads the train config file, get the train_params, model_params, vis_params -> Calls the train method in utils.train.py file
- train.py = Loads the training, visualization, transformation and model parameters -> Form the model by calling models.models.py -> Configures the data loader by calling data.databuilder.py with preprocessing defined using transformation in utils.transformer.py -> Sets the class weights -> Visualizes the training and validation samples (histograms, images; with and without the preprocessing) -> Define the directories, model version and create/check paths -> Define the optimizer and scheduler -> Define the loss function using utils.loss.py -> Initiate the training epochs -> Record training and validation evaluation in the form of dictionary obtained using utils.eval.py and also Tensorboard summary writer is created that records train and valid loss over each epoch. -> Saves the weights of the model that obtained best results over the epochs.
python train_caller.pyTesting
- test_caller.py = Loads the test config file, get the test_params, model_params, vis_params -> Calls the test method in utils.test.py file
- test.py = Loads the testing, visualization, transformation and model parameters -> Form the model by calling models.models.py -> Configures the data loader by calling data.databuilder.py with preprocessing defined using transformation in utils.transformer.py -> Visualizes the test samples (histograms, images; with and without the preprocessing) -> Record test evaluation in the form of dictionary obtained using utils.eval.py -> Visualize the predictions on random samples. -> Visualize with gradcams on the random samples by using utils.interpret.py
python test_caller.pyFile details
- configs.cfg_test.yaml and configs.cfg_train.yaml contains the necessary variables to configure data, model, directory to save results, and other environment setup
- data.databuilder.py = Defines the preprocessing pipeline by using utils.transformer.py and provides the functionality to return data loader
- data.dataset.py = Called by data.databuilder.py that reads csv file containing columns of the file path and labels
- data.transformer.py = Can add transformations based on the requirement for train, validation and test.
- models.models.py = Here we can define our model. By default there are multiple state-of-the-art classification models are available.
- utils.eval.py = Accepts the true labels and predicted probabilities to compute the performance metrics. In case of the binary we use a single neuron so to generate a threshold for classification, we maximize the harmonic mean of two vectors either by using the PR curve or the ROC curve
- utils.interpret.py = Has functionality to interpret the results generated by the model.
- utils.logger.py = Just add in case we want to create separate logs
- utils.loss.py = Contains the functions for different loss functions (weighted/non-weighted, binary/multi-class)
- utils.optimizers.py = Defines the optimizer and scheduler for training
- utils.test.py = Contains the main logic to test the trained model.
- utils.train.py = Contains the main logic to train the model.
- utils.visualize.py = Has the functionality to visualize the random samples and histograms from the cohort.
Output
The results are generated in the ‘results’ directory in the format as ‘results/<model_name>/<time_stamp>/’. This directory contains the tensorboard logs, model weights, GradCam images, Prediction images, training and validation dictionary pickle objects containing each and every metric information per epoch and an ‘epoch_csv’ directory containing the train and validation csv files generated for each training epoch having columns of file path, probabilities and true label.
Tensorboard logs can be viewed by using following command:
tensoboard --logdir=<Path_to_the_event_logs>Simulation
For output generation purpose only, this framework was simulated on COVID-19 CXR dataset on Kaggle:
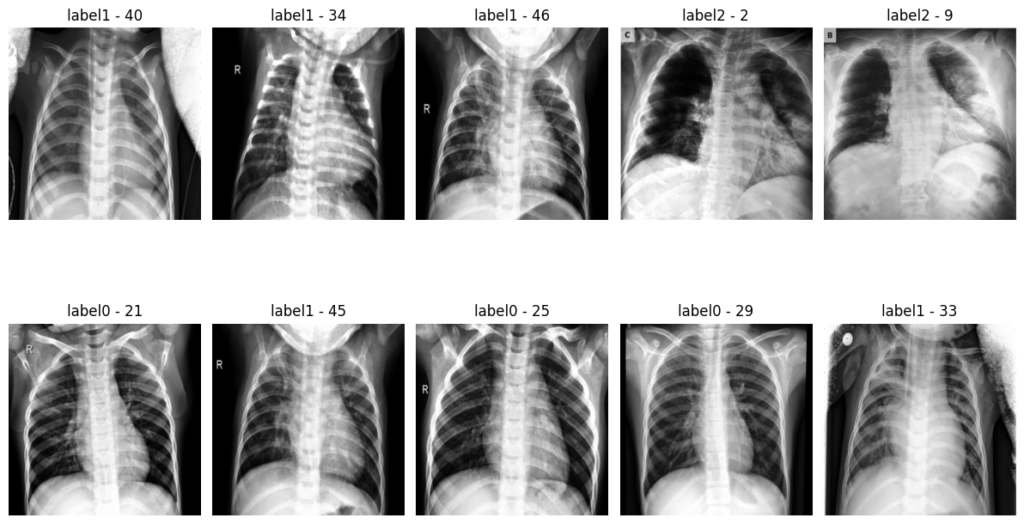
Dataset before transformation:
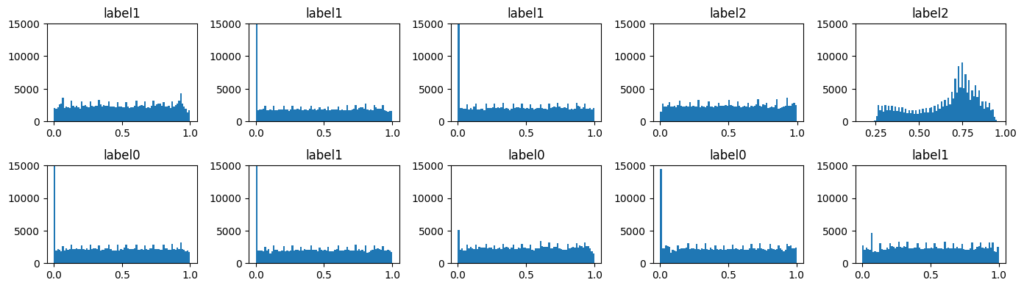
Dataset after resize transformation and standardization:
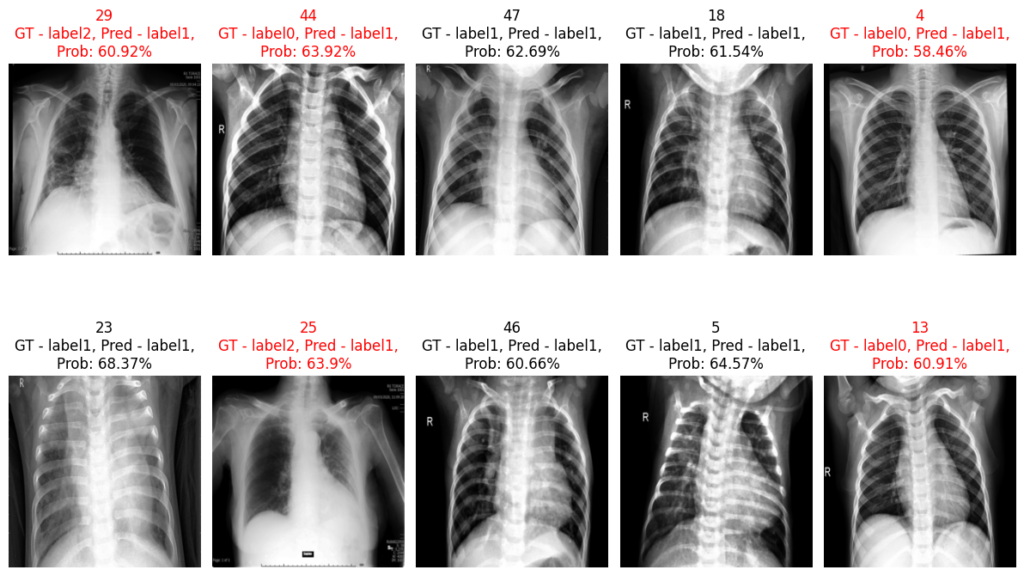
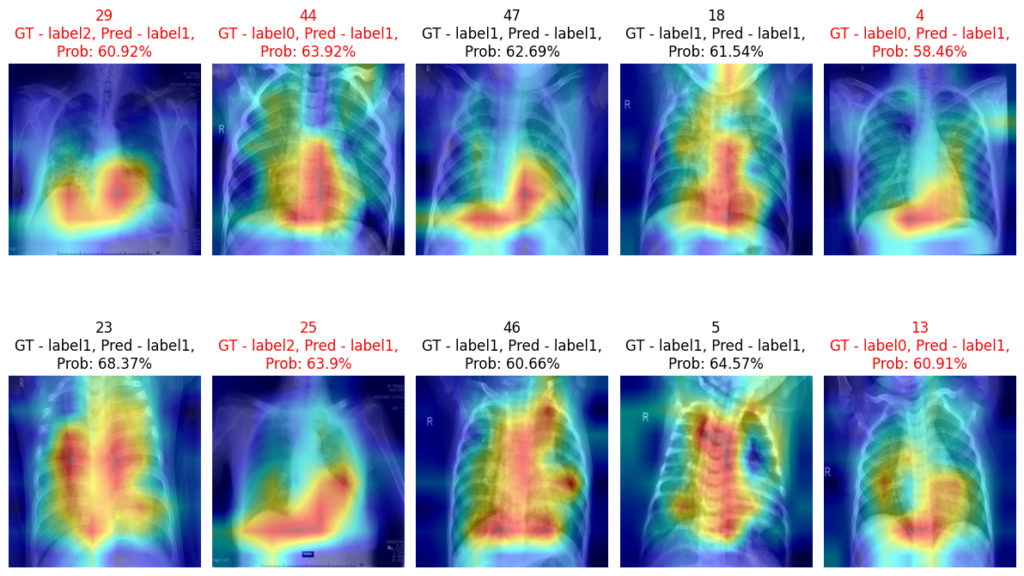
Predictions: